
Understanding and Measuring the Narrative Arc
When a person is telling a story to an audience, they are not just telling a story — they are engaged in a deeply intricate and rich social psychological process. Storytelling is a topic that has fascinated scholars for thousands of years. We are only now starting to understand the complex psychological scaffolding that underpins the structure of stories.
The Narrative Arc analysis within LIWC-22 builds on previous research showing that storytellers tend to go through a unique "unfolding" of word use when constructing their narratives (Boyd et al., 2020):
- First, they start by using lots of words that pertain to nouns and how they relate to one another: this is called "Staging" language.
- Once the storyteller has set the stage, they often use less "Staging" language and begin to use more words that signal action, and words that imply a shared understanding of who is engaged in those actions, and how those actions are transpiring, and so on. This is the language that drives a story forward: "Plot Progression" language.
- Importantly, all the while, most storytellers build and release psychological tension through some form of conflict: either by having characters struggle to attain their goals, or structuring situations in such a way to where it is uncertain whether characters' goals will be achieved. Traditionally, this "Cognitive Tension" rises and then peaks around the middle-to-later parts of a narrative.
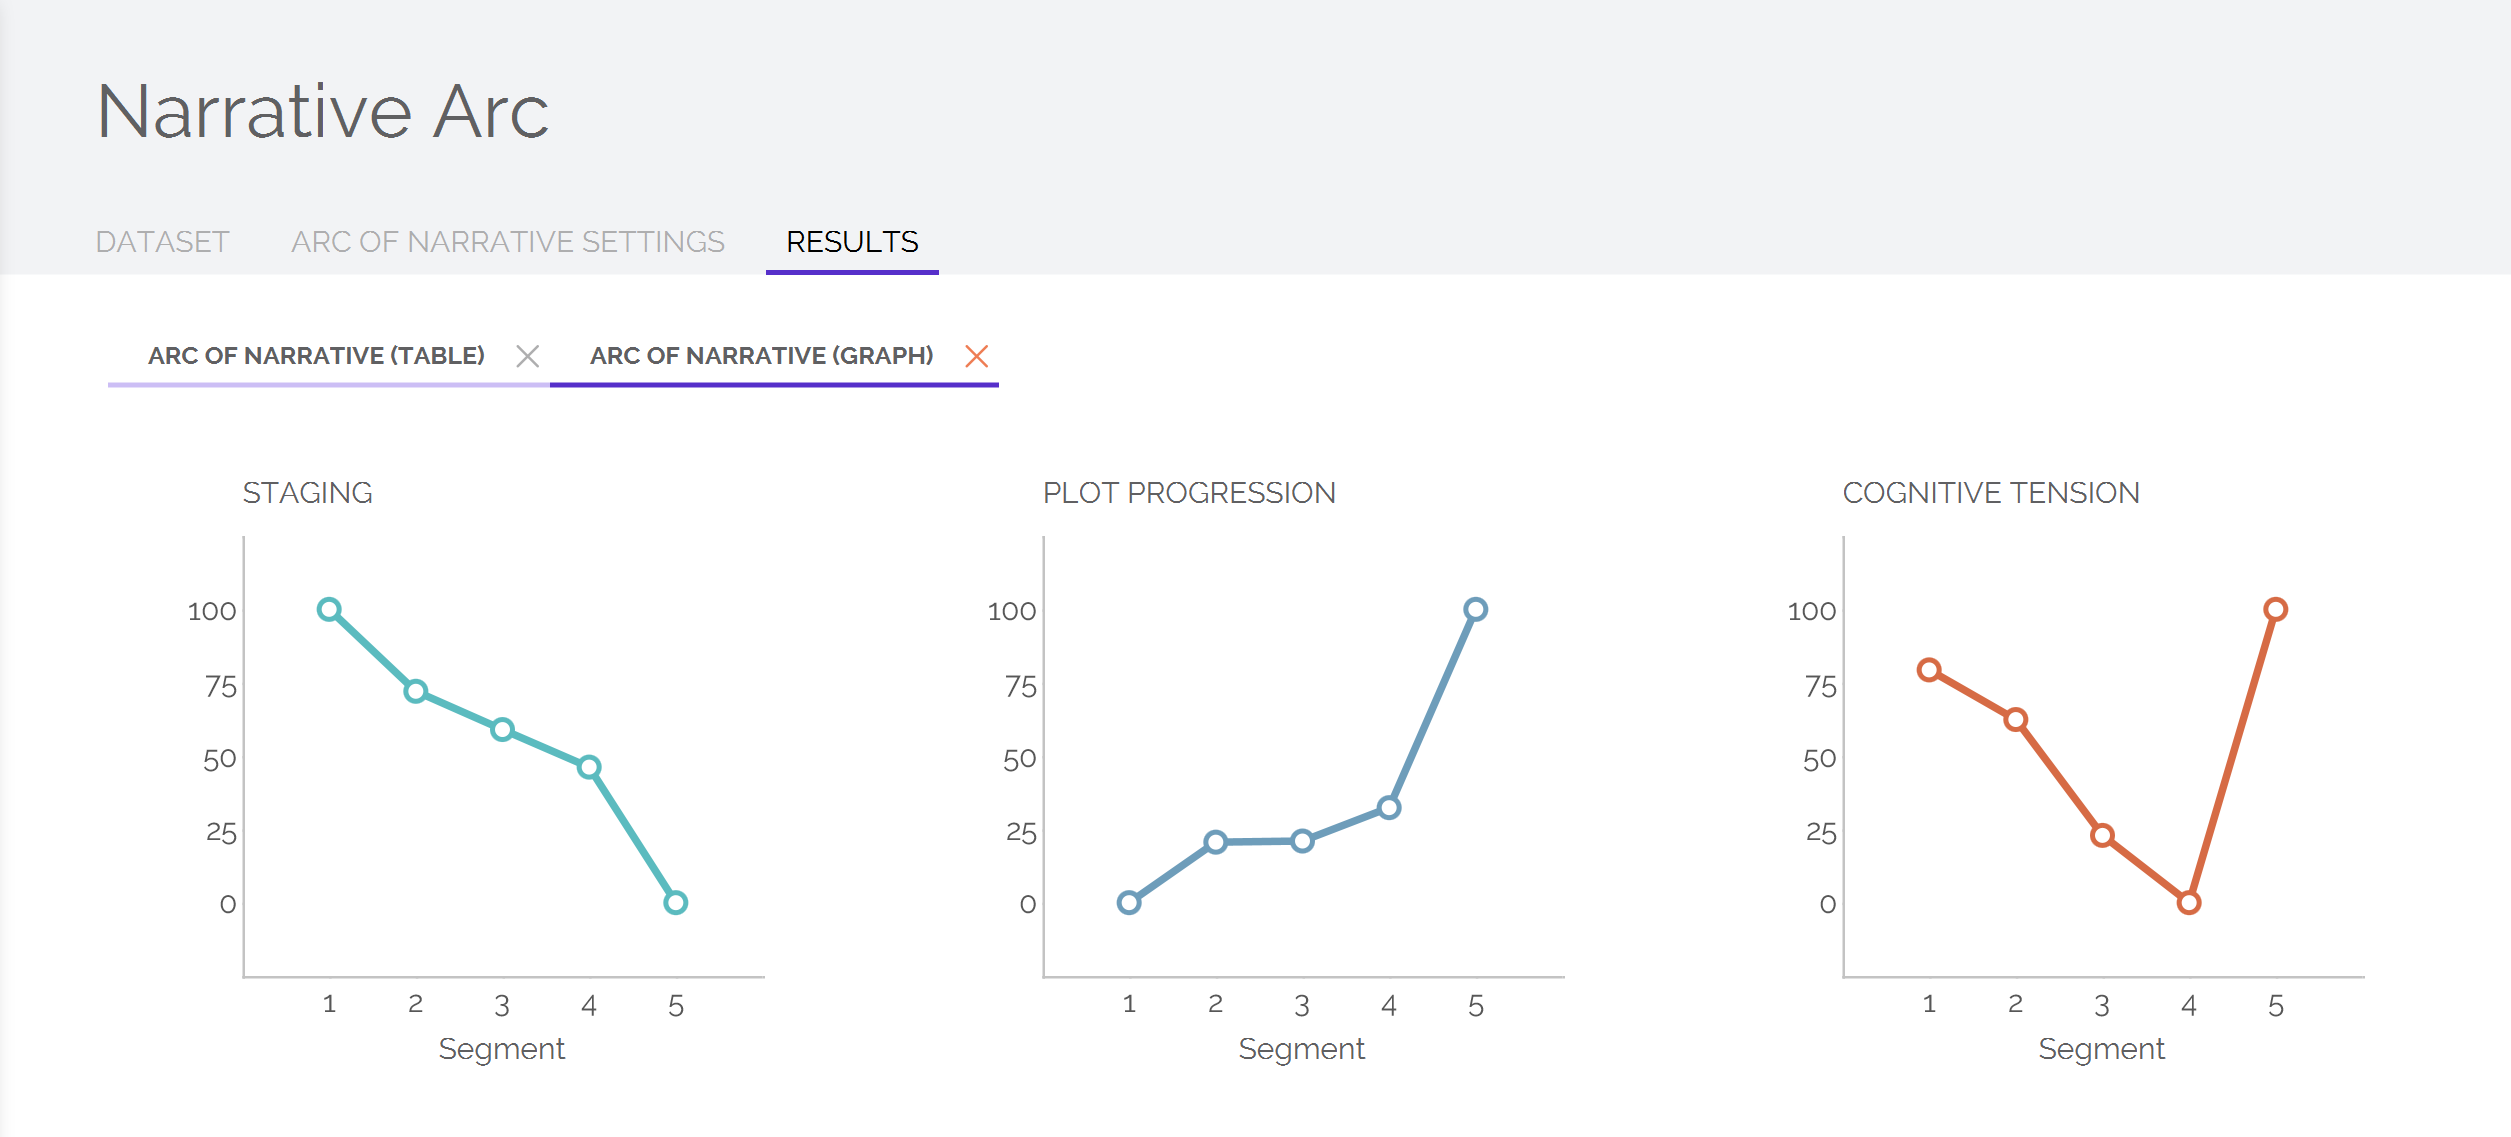
Indeed, this general "pattern" of verbal behaviors jointly constitute a common, standard "arc of narrative" as seen here:
Narrativity Scores
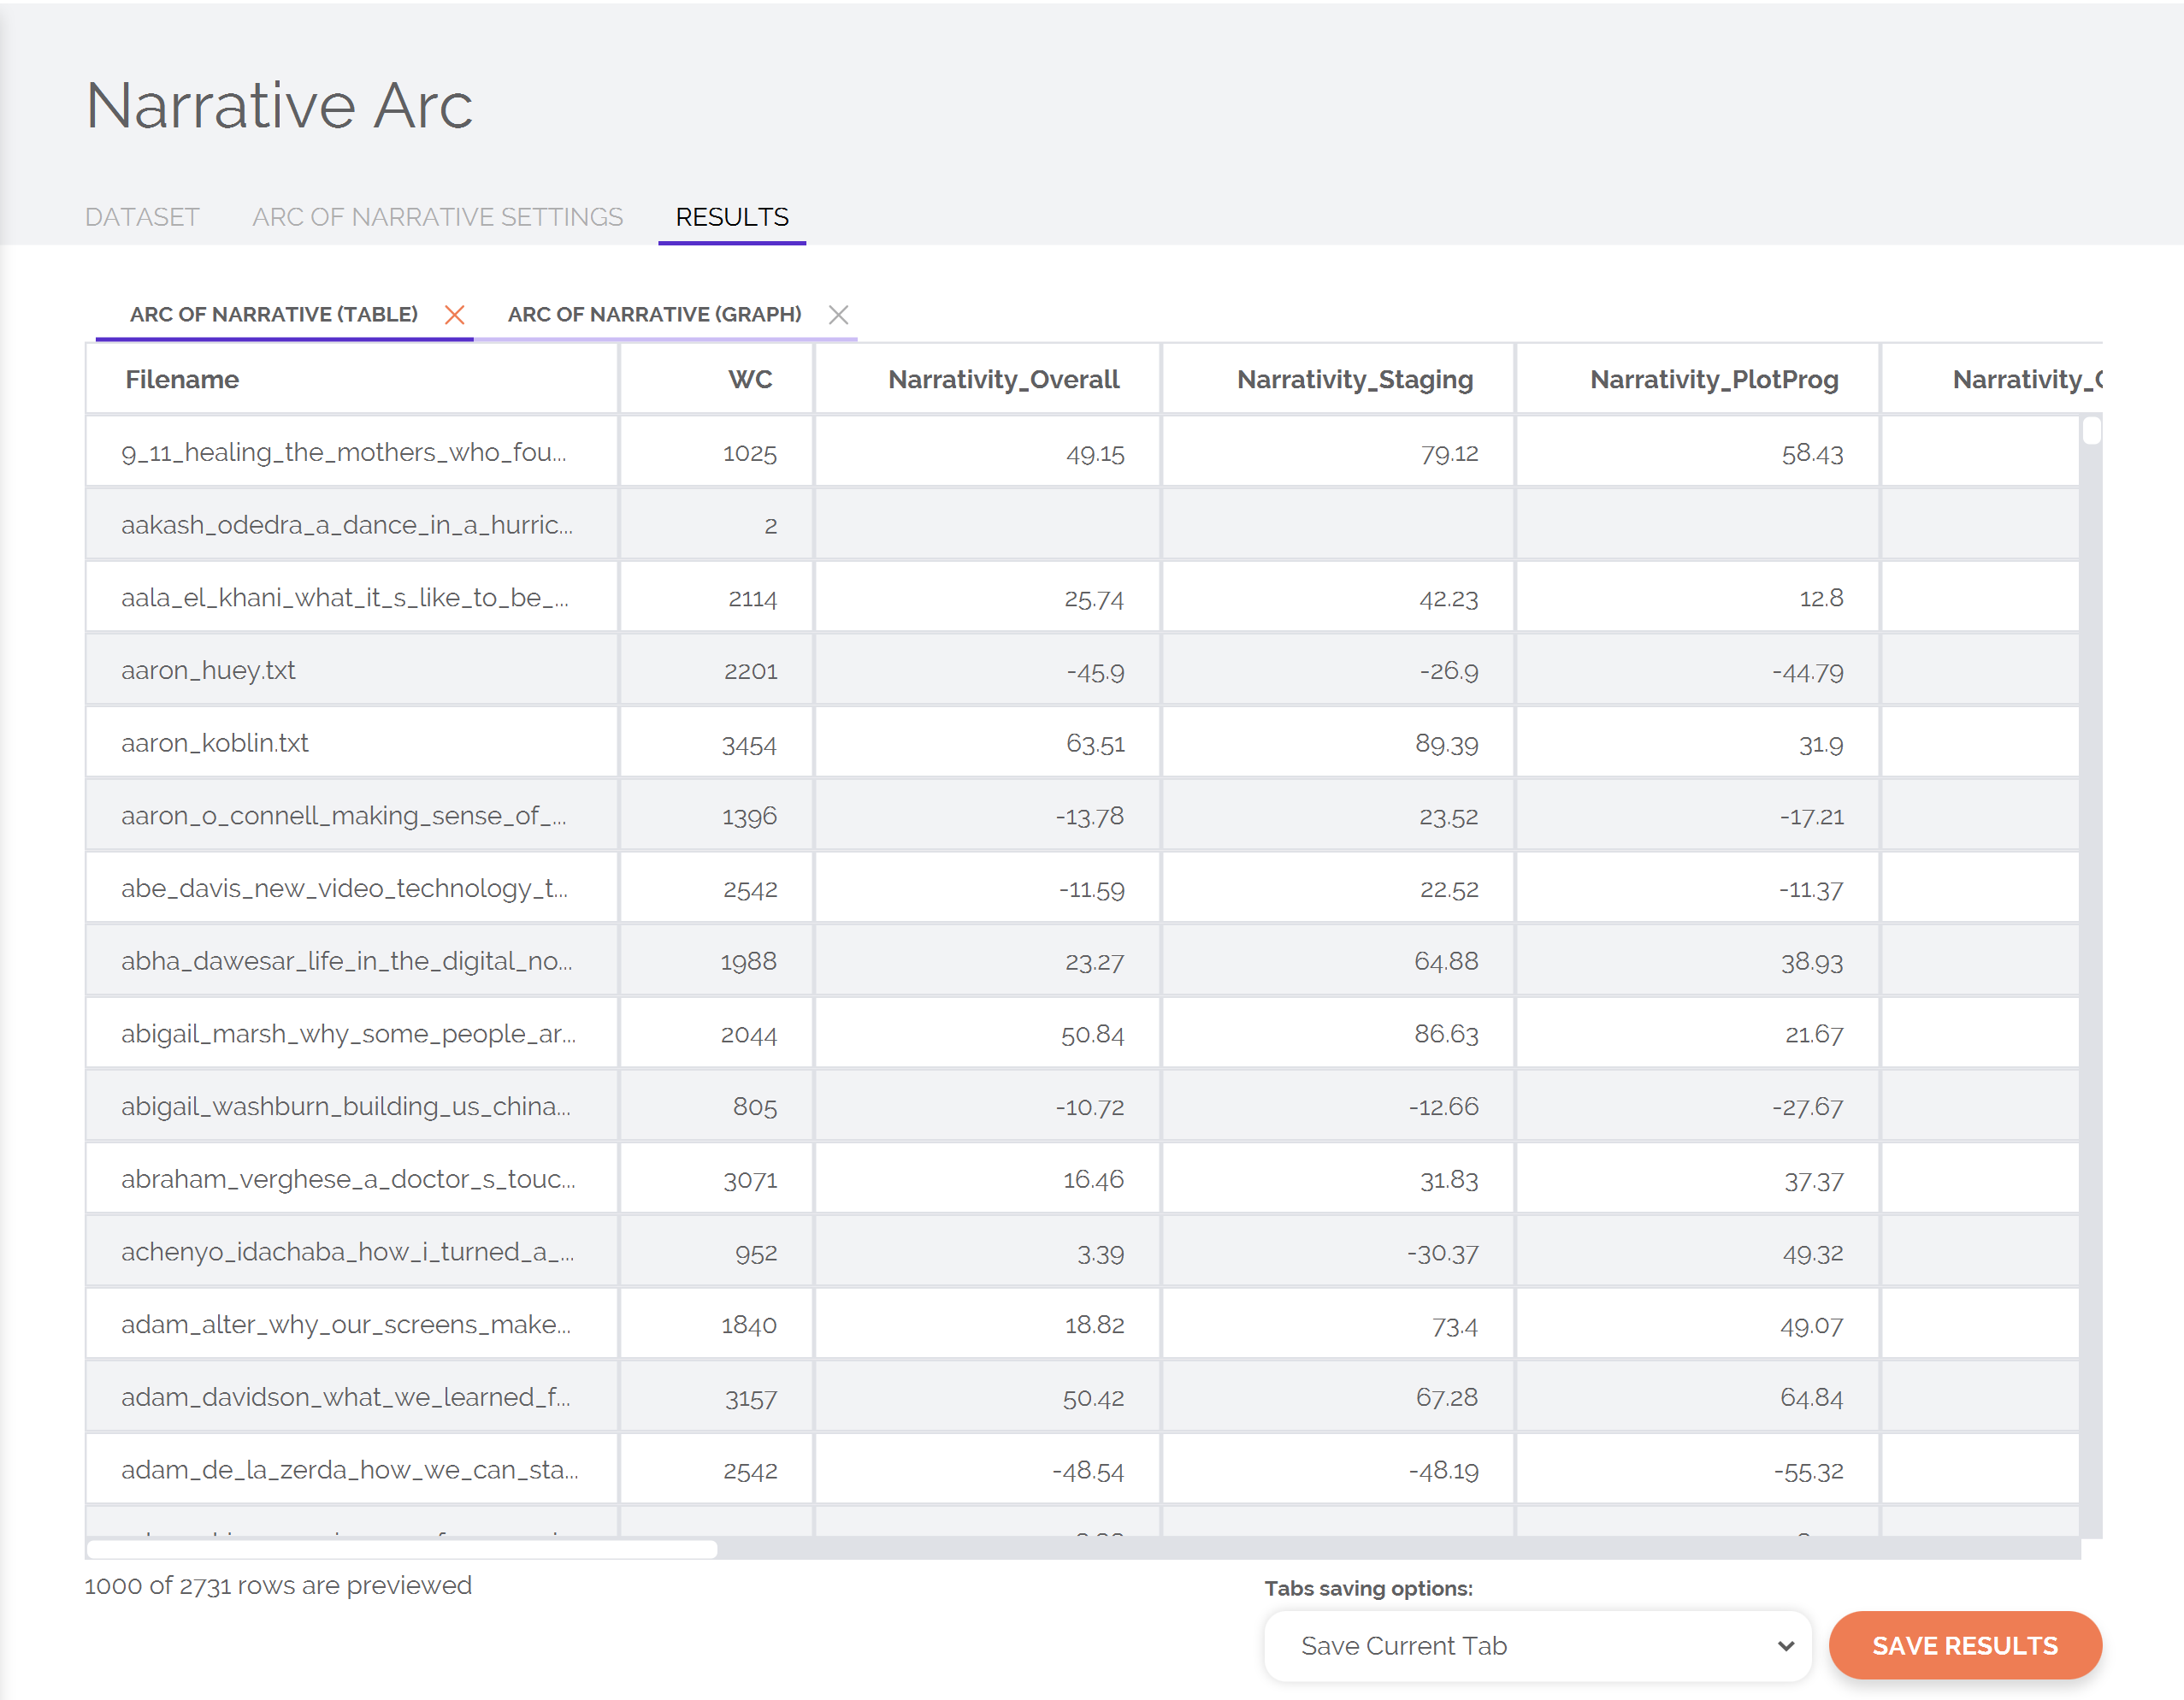
Using the Narrative Arc feature of LIWC-22, it is possible to map out the shapes of Staging, Plot Progression, and Cognitive Tension in your dataset. LIWC-22 can also provide you with Narrativity scores that reflect how closely any given text resembles the "standard" structures seen above. LIWC-22 provides the Narrativity scores for each narrative dimension, as well as the overall narrativity score, which reflects the average of all 3 dimensions' narrativity scores.
In general, the various narrativity scores can range from -100 to +100. A narrativity score of 100 is one where the shape of a narrative process in a text is perfectly aligned with the normative shapes shown in the figure above. For example, a text with a "staging" score of 100 will start with very high staging, then rapidly fall to a relatively "flat" lower level of staging for the rest of the story. On the other hand, a text with a score of -100 can be thought of as showing the opposite shape as what is normative. In this case, for example, a story with a -100 score for staging is a mirror image of what is seen in a traditional story: it starts with very low staging, which remains relatively "flat" until a rapid rise in staging at the end — imagine, for example, a murder mystery where you only receive all of the relevant background information at the very end of the story, once you have found out "whodunnit."
Put another way, more positive narrativity scores suggest that a story is following a standard, traditional story structure. More negative scores, on the other hand, are more strongly showing an inverse pattern from what is found in a standard, traditional story. Scores that are near zero are completely dissimilar from a standard story structure altogether, exhibiting a pattern that cannot be characterized as "normative" in any way.
PROTIP: A higher narrativity score does not necessarily imply a "better" story. Instead, it simply suggests that the storyteller/speaker is using these well-established methods of structuring and conveying information to others. The things that make a "good" story are complicated and depend a lot on the nature of the relationship between the storyteller and their audience. For example, a good jazz solo is often one that deviates in surprising ways from established trends in the genre. However, a good pop song is typically one that gives its audience exactly what they're looking for. We caution against the over-interpretation of narrativity scores as "good" versus "bad" and instead encourage you to think about what it means when a storyteller does (or does not) rely on established narrative structures.
Narrative Arc Method and Settings
If you are new to the Narrative Arc world, several aspects of the settings/results may not be obvious. In this section, you will find information on the specific settings that you can use when conducting a Narrative Arc analysis.
Segments
The simplest way to track how a story's structure "unfolds" is to split the text into N segments, then quantify each narrative process within each segment. In the past, we have found that 5 segments is a good number of segments to use — it strikes a balance between having enough words per segment to remain a reliable analysis, yet gives us enough resolution to see narrative processes unfold. Note that we have also explored other numbers of segments as well — if you wish to use some number other than 5, this will likely be okay, but you will want to be sure that your decision is justified.
Scaling Method
The purpose of the Narrative Arc analysis is to understand how narrative processes unfold within a story, but in a manner that allows us to compare narrative processes across multiple texts. In order to quantify narratives in a way to where each structure's shape can be directly compared, we first standardize the scores that reflect each narrative process. This standardization can be done in two different ways: using a z-scoring method, or a linear feature scaling (LFS) method (specifically, a min-max normalization approach that scores each narrative process on a scale where the minimum = 0 and the maximum = 100). In general, the specific method you use to scale your narrative structures will not make much of a difference on your end results, however, we recommend the LFS approach for interpretability. Using the LFS approach means that, for each narrative process that is measured, the "lowest" point will be scored as 0 and the "highest" point will be scored as 100. As an example, imagine a story that starts with a high degree of "Staging" that slowly falls off, with the least amount of staging occurring at the end of the story. This means that the first segment will be scored as 100 for staging, the last segment will be scored as 0 for staging, and all segments in-between will reflect their relative standing to these high and low Staging points.
Include "Peaks" and "Valleys" in Results
The "official" way of scoring narratives is to quantify how similar each narrative "shape" is to a established norms that have been found in past research. However, we also know from existing that various types of narratives often exhibit their own standard structures that might deviate from what a "traditional" story might show. In such cases, you may be more interested in quantifying when each narrative process is at its highest or lowest rather than its adherence to a traditional story-like structure. For example, if you are interested in whether cognitive tension peaks earlier or later within a story, you may simply choose to include the "peak" for cognitive tension in your output — the "peak" score will simply tell you which segment in each text showed the hightest value for each dimension. Similarly, the "valley" scores will reflect which segment in each texts had the lowest value.
Include Individual Points in Results
By default, the Narrative Arc analysis will quantify the "shape" of each narrative process (staging, plot progression, and cognitive tension), then provide a "narrativity" score that reflects each shape's similarity to established norms. This similarity score is effectively a rolling-change distance metric. However, you may want to analyze the individual scores for each segment, for each narrative process as well. Checking this option will provide the scores for each narrative process within each segment of your text. Note that these scores will be normalized as described above.
Minimum Word Count
First, and perhaps most importantly: the minimum Word Count. The Narrative Arc analysis works by taking each text and splitting it into equal parts (5 by default). However, a basic principle of psychological text analysis is that you typically need a decent amount of text to get reliable inferences about its properties. In the case of stories, we typically recommend a minimum of 250 words or more — that is, 50 words × 5 segments = 250 words in total. If you are working with larger texts and want to set a more conservative inclusion threshold, you can set your minimum word count to a higher value (e.g., 1,000) to omit any texts that do not clear this minimum threshold.
Narrativity Plots
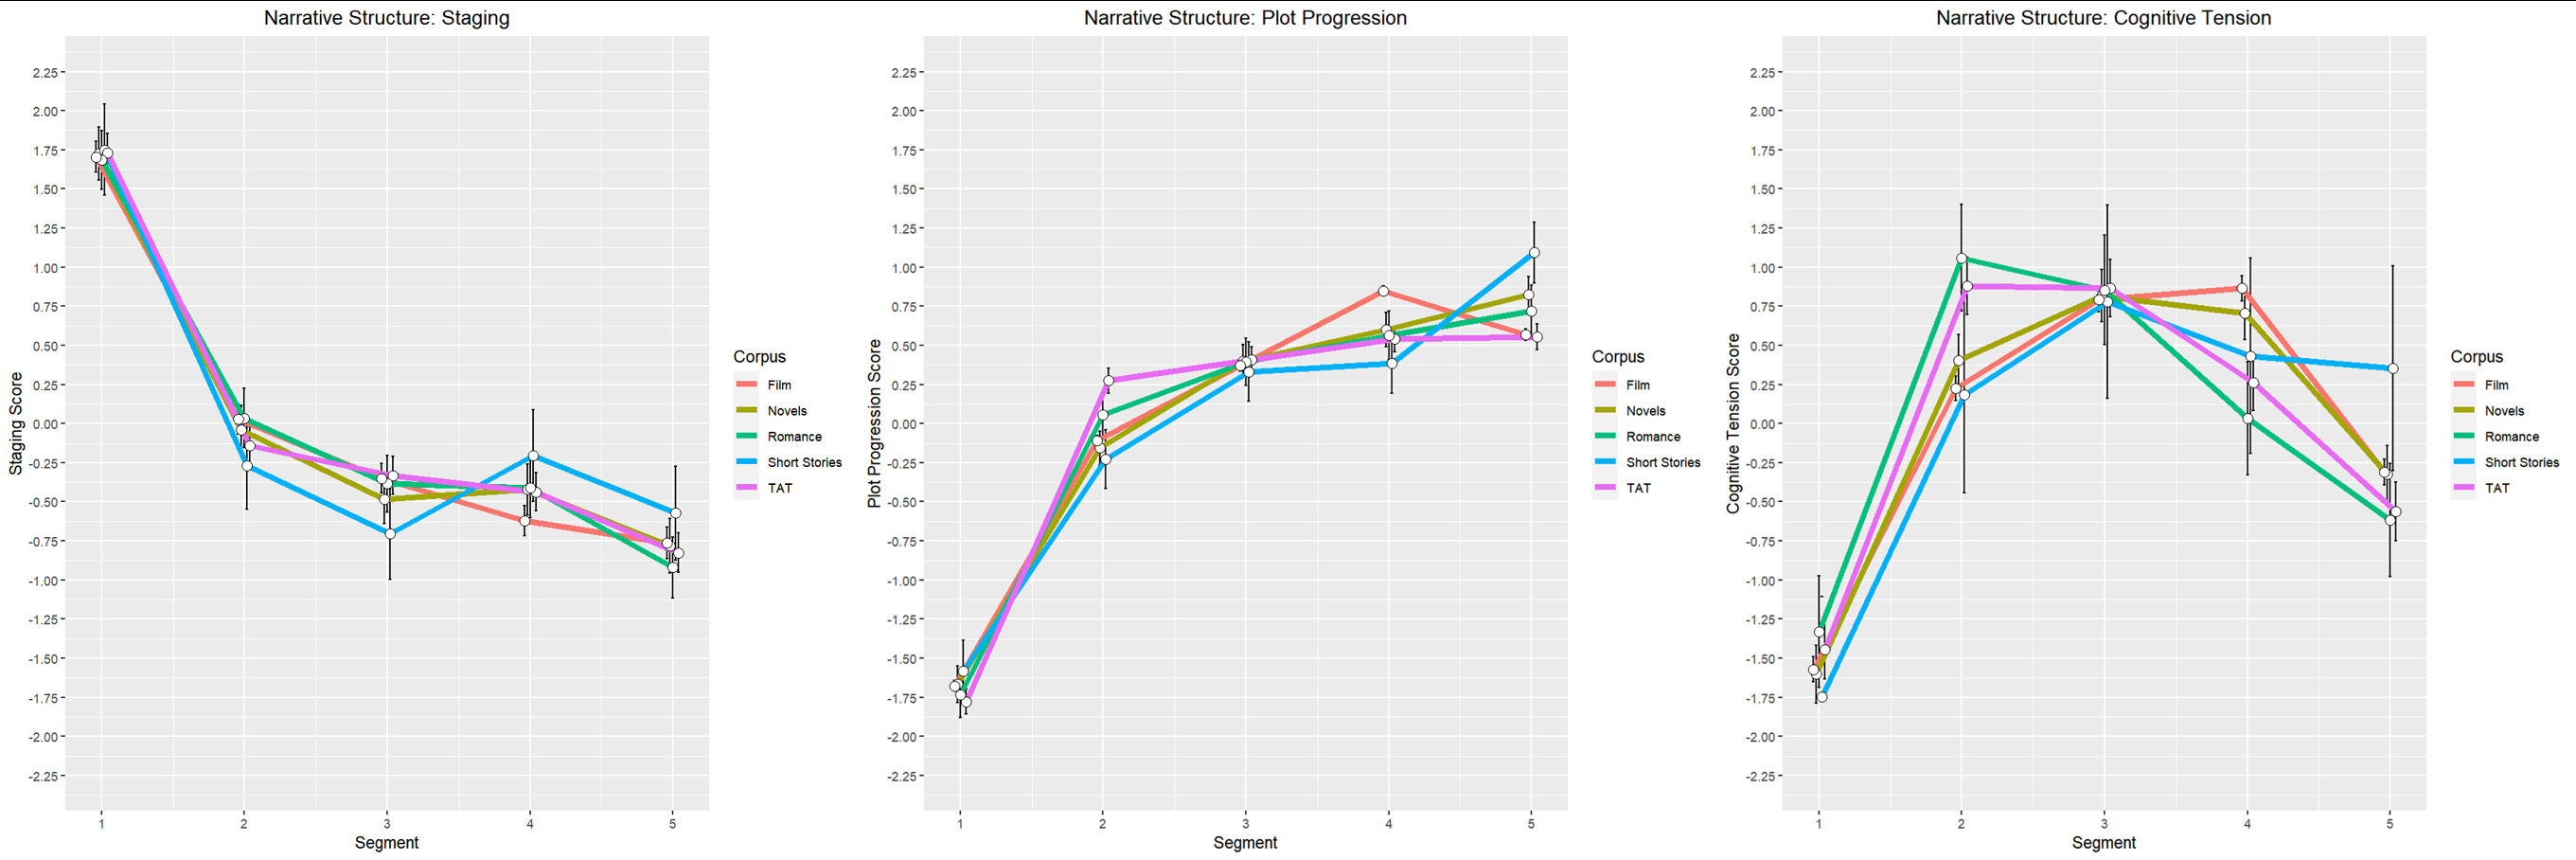
The Narrative Arc analysis within LIWC-22 is also able to generate graphs that show your dataset's normative shapes as well. For example, here is an analysis of a large collection of TED Talk speeches:
Plots can be saved as .png or .jpeg files as well for use in presentations, reporting results in peer-reviewed publications, and so on.
References and Further Reading
- Boyd, R. L., Blackburn, K. G., & Pennebaker, J. W. (2020). The narrative arc: Revealing core narrative structures through text analysis. Science Advances, 6(32), 1–9. https://doi.org/10.1126/sciadv.aba2196
- Nalabandian, T., & Ireland, M. E. (2019). Genre-typical narrative arcs in films are less appealing to lay audiences and professional film critics. Behavior Research Methods, 51(4), 1636–1650. https://doi.org/10.3758/s13428-018-1168-7